If you want to know how to track your marketing campaign traffic in GA4, you’ve come to the right place.
After years of using UA, it took us a minute to figure out how to get the same information out of GA4, so we thought it would be helpful to share.
So, there are a couple of ways you can track your marketing campaign traffic in GA4. The first one is through Traffic Acquisition and the second is by setting up custom reports through the explore tool.
I’ll talk you through how to do both, so you can easily monitor your marketing campaigns, keep track of their progress and use the data to track your campaigns for the best results.
Campaign traffic comes from your inbound marketing activities. Campaign traffic refers to the visitors who arrive at a website by clicking on a link that has been tagged with special campaign tracking parameters.
These parameters are added to the end of the URL, and when the link is clicked, they are sent to Google Analytics along with the standard page view data.
This allows you to track and analyze the performance of your campaigns and see how much traffic, engagement, and revenue they are driving.
 To find traffic that has come from campaigns in GA4 you can use Acquisition and Traffic acquisition. This will be under the Reports tab.
Look for Traffic Acquisition under the Acquisition tab and then change the session default channel group drop-down to ‘session campaign’.
From here you’ll be able to see the name of the campaign, the amount of users that have visited your site, the sessions, average engagement time per session, and events per session, and gives you more stats as you go across the page.
If you want to see more campaigns, you can increase the rows per page to 250 and you’ll be able to see more campaigns.
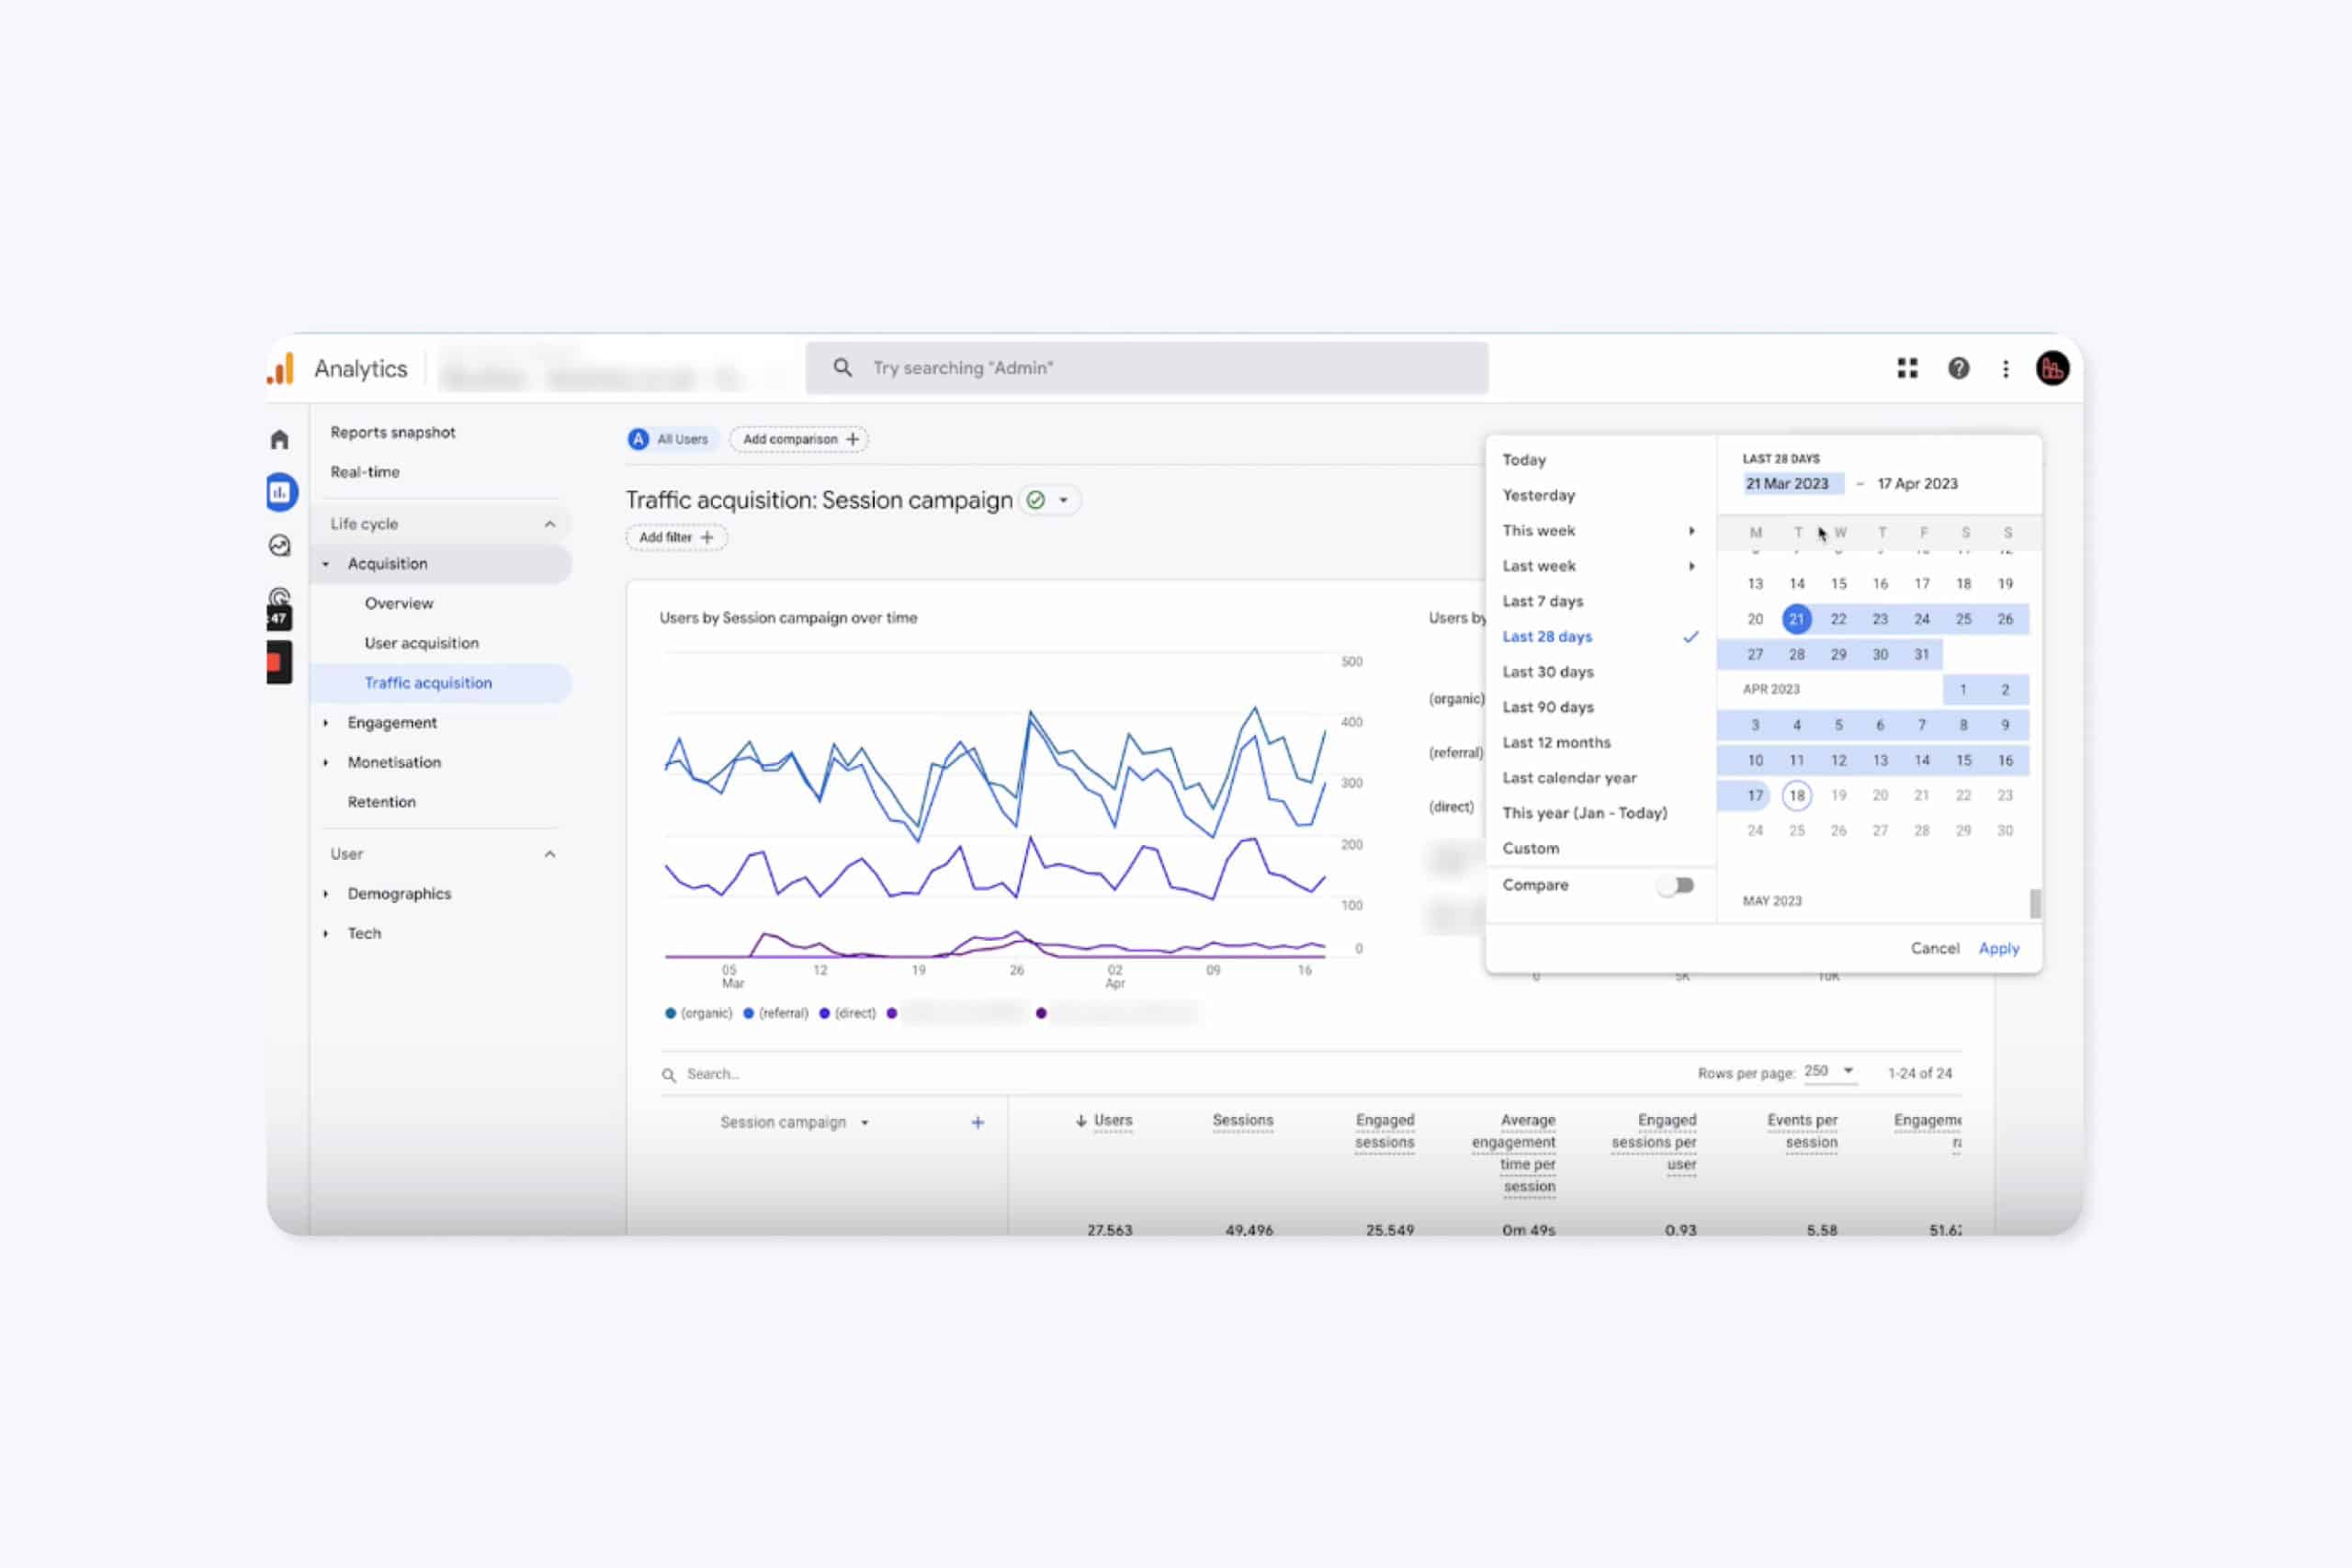 You can also apply filters to your report if you want to narrow the data down and select the date range you want to track. This is important if you want to track specific time periods.
Exploratory Reports in GA4 allow you to get deeper insights into your users' behaviour through a collection of advanced customisable features that allow you to answer specific questions with your data.
“While the default reports in Google Analytics help you monitor your key business metrics, Explorations gives you access to data and analytical techniques that aren't available in reports.” - Google
Here’s what you can do with the GA4 explorations tool:
Quickly perform ad hoc queries
Easily configure and switch between techniques
Sort, refactor, and drill down into the data
Focus on the most relevant data by using filters and segments
Create segments and audiences
Share your explorations with other users of the same Google Analytics property
Export the exploration data for use in other tools
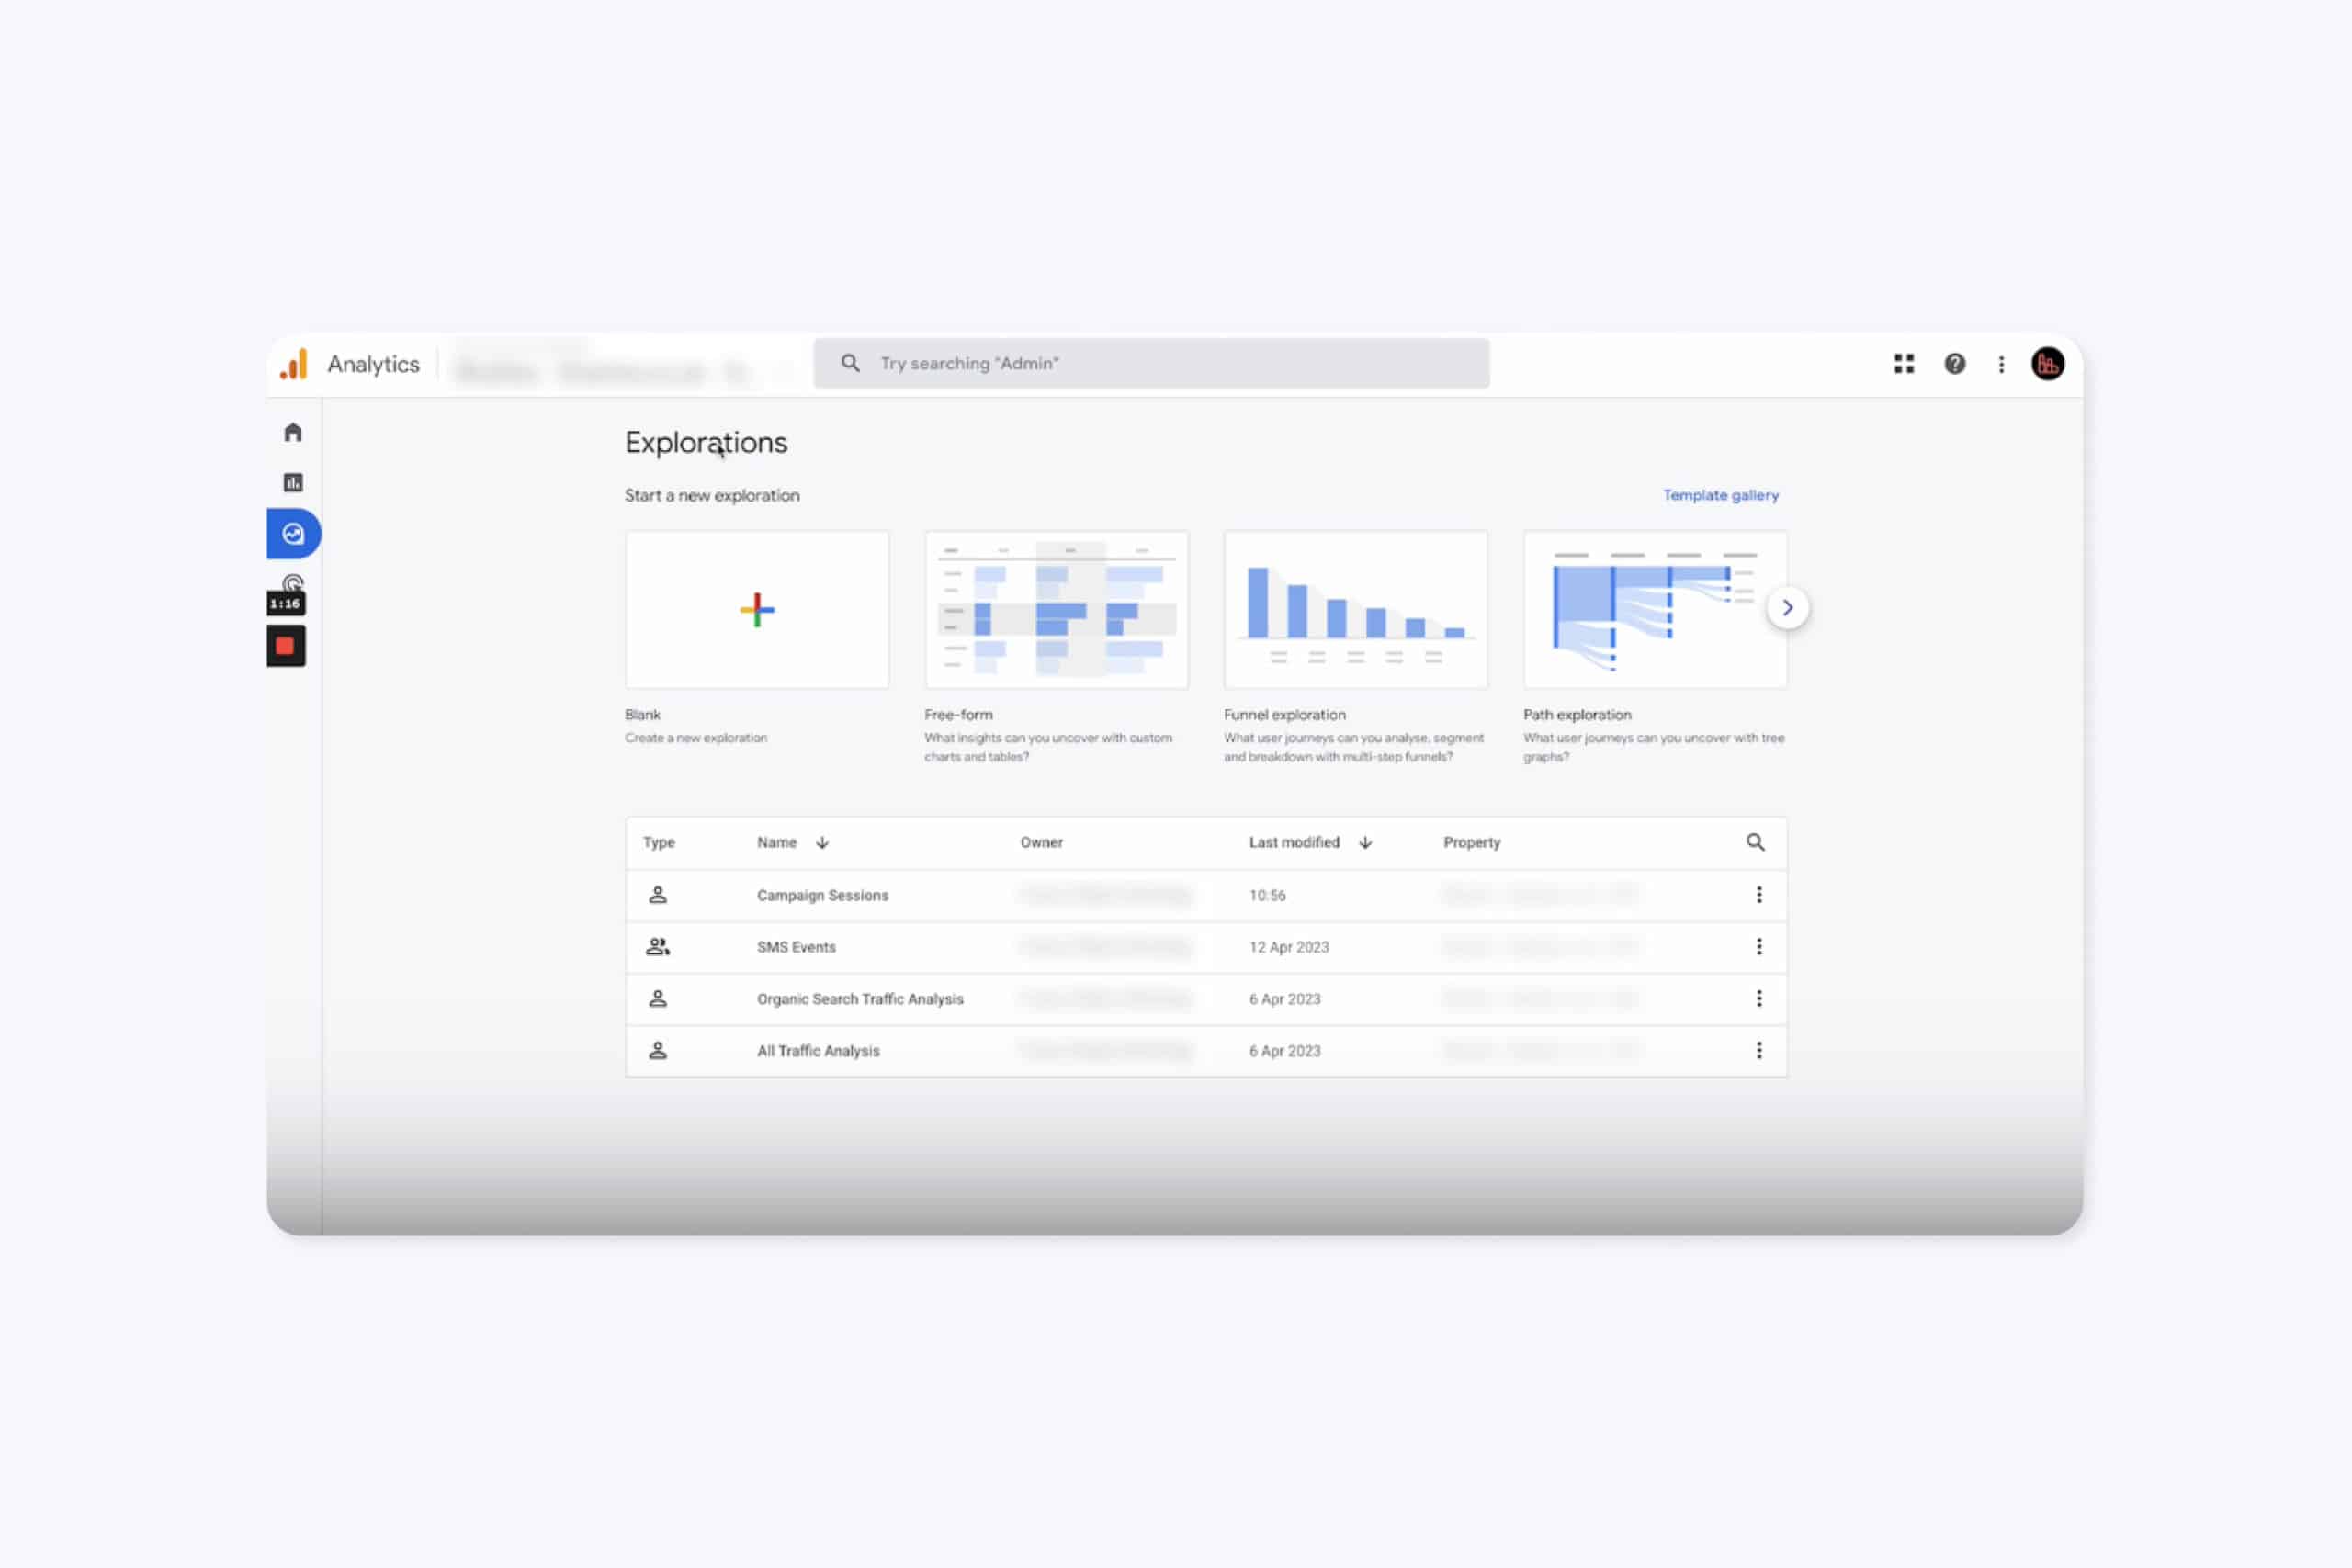 To create an Exploratory Report find Explore in the main menu of GA4 on the left under the Reports tab.
From here you’ll need to set up a new blank exploration and customise the tracking options from there.
I’ll talk you through a simple Explore report that I’ve already set up. It looks like a lot, so I’ll show you the basics so you’ll be able to customise your own reports from there.
The first thing I do is give your Exploratory Report a name, this helps to identify your custom report and find it easier. Super important when you build a lot of reports.
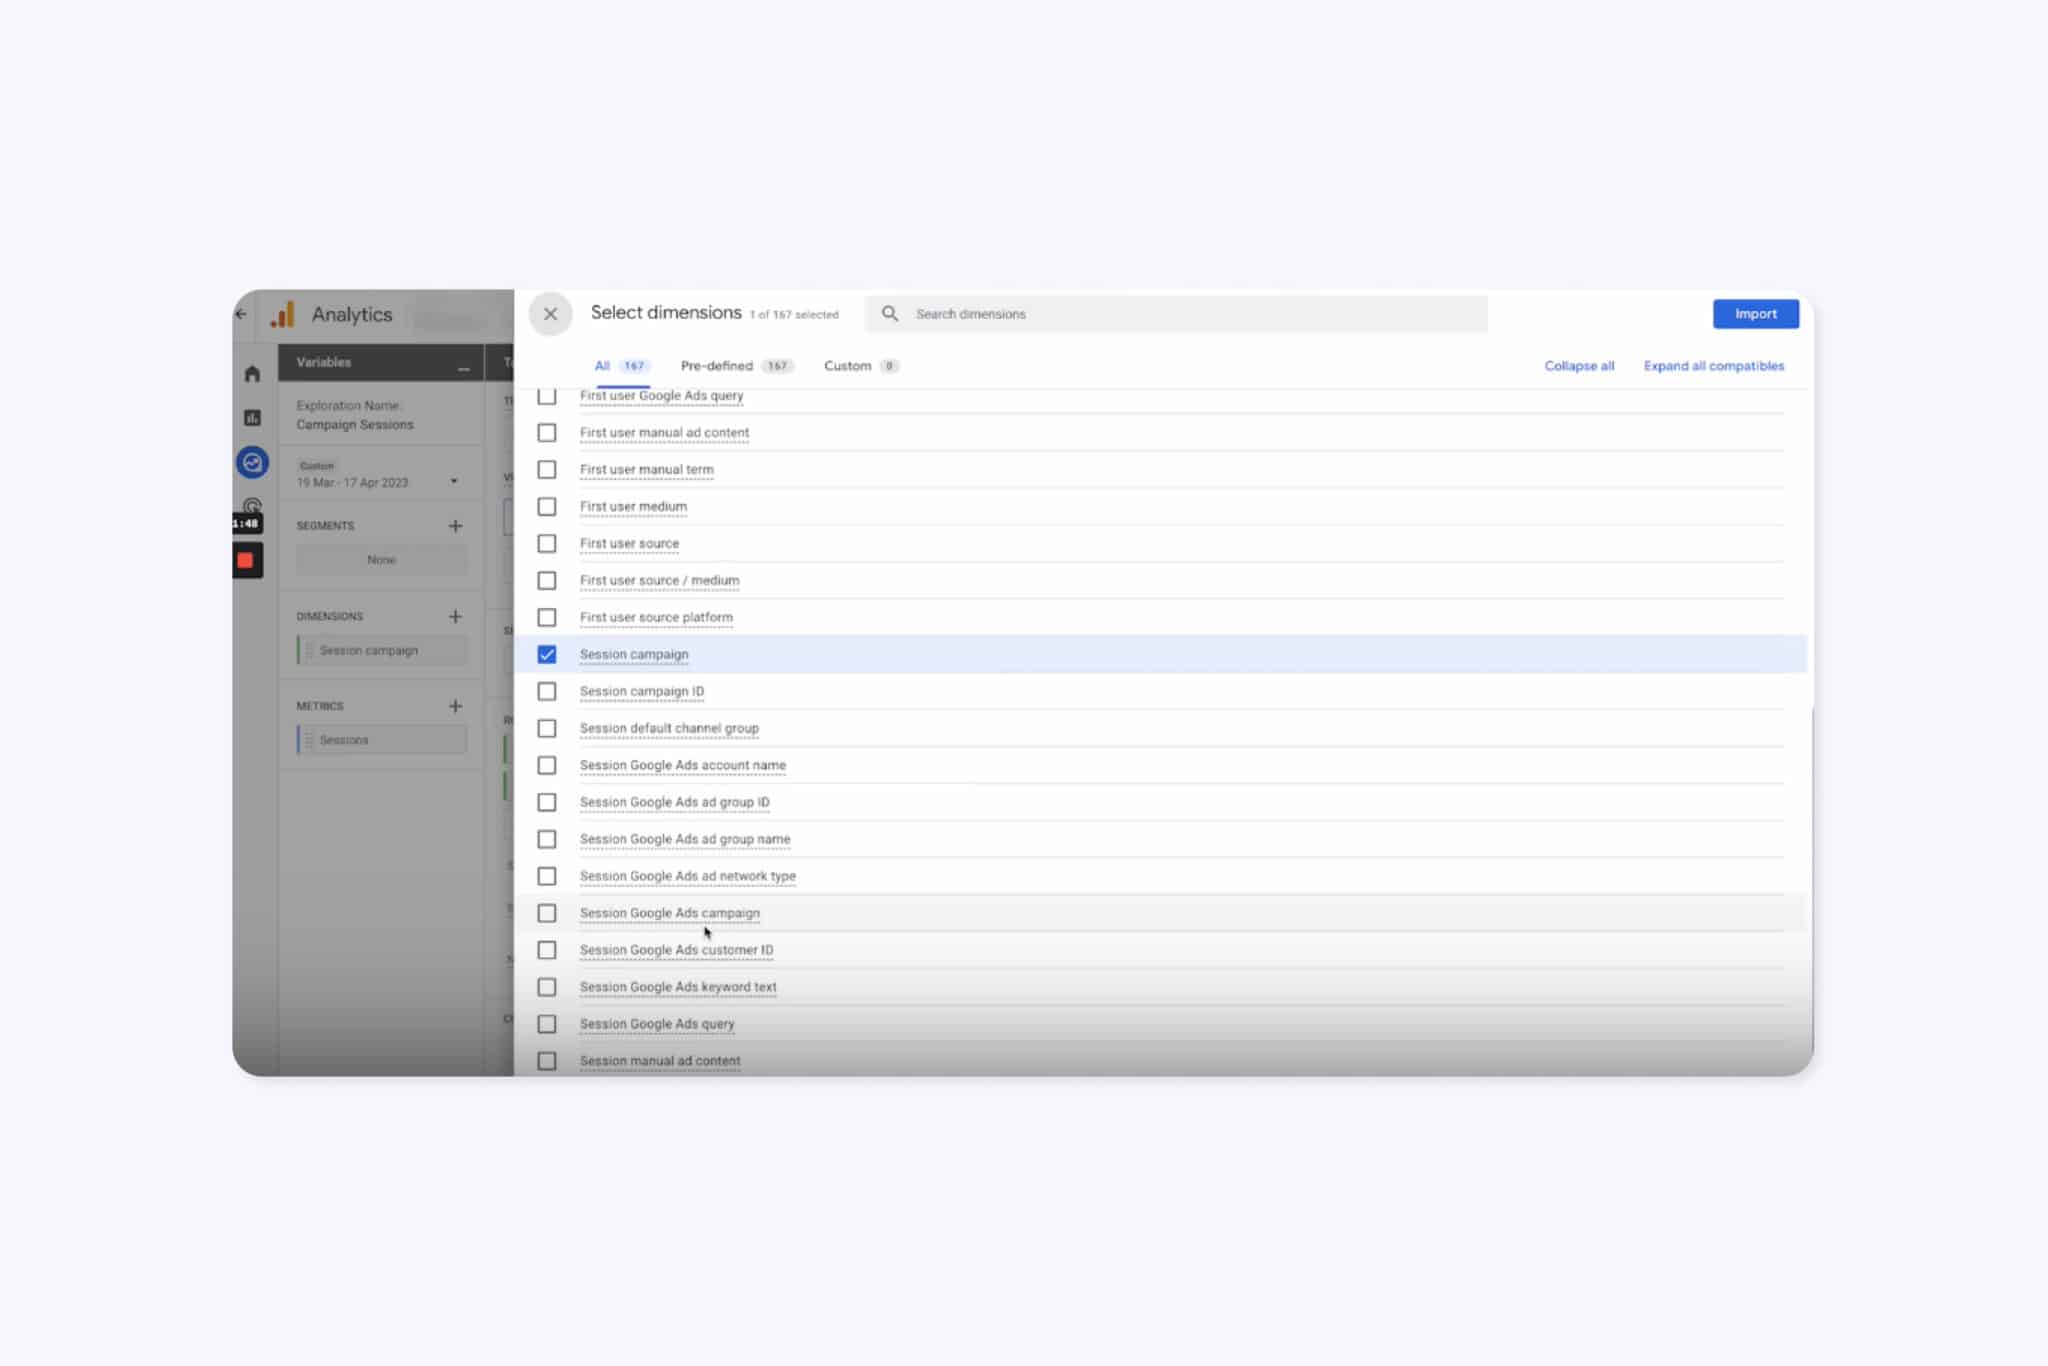
Then you need to give your report dimensions, these are custom parameters or properties you set that are specific to your business needs.
You can choose from a list of metrics including demographics, ecommerce, event, and traffic source, which is the dimension that I’m tracking in my Exploration.
The dimensions you need to add to track campaign traffic
So you just add the dimensions you want to track and you can add multiples from the drop down. I’ve gone for:
Session campaign
Session source
 These dimensions give you the name that was set for your campaign, e.g “Spring Summer Product Launch Video”, and where it’s come from, e,g Facebook ads. The metrics you need to make sense of your campaign traffic Next, set your metrics, which will give you the results from the dimensions you’ve set.
I’ve chosen 2 metrics (you can pick more):
Sessions
Total users
This will tell me how many sessions a campaign received and the number of total users at the specific time frame I set to report on.
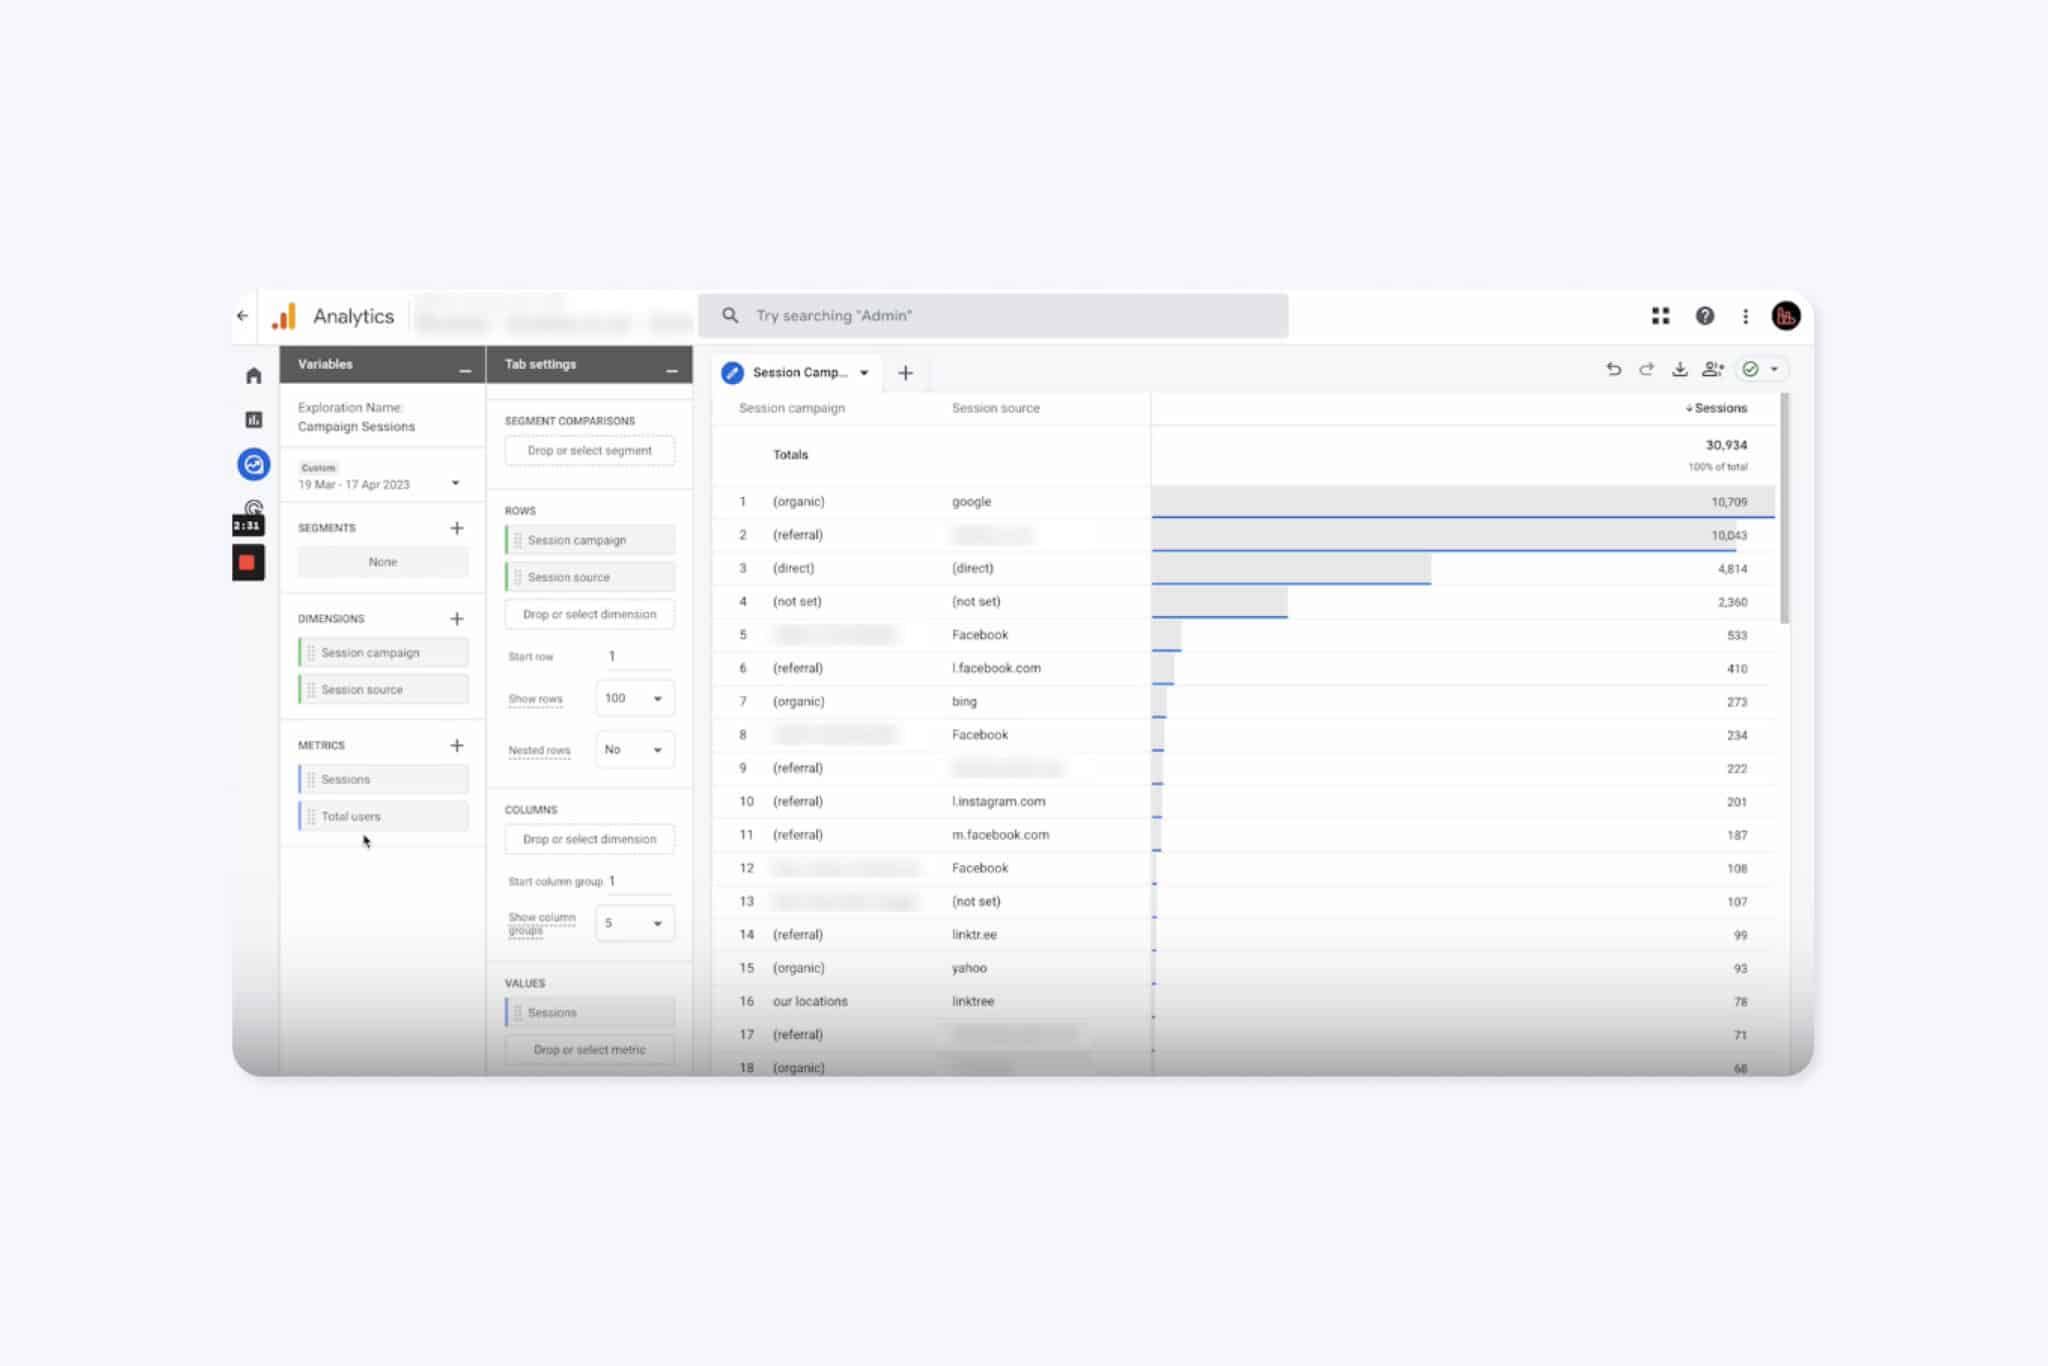 To view the data you need to double-click on the dimensions and metrics you’ve selected in the Variables column and they will appear in the Tab settings column and your custom report will build in front of your very eyes. Magic!
This will give you a basic starting point for creating Exploratory Reports and using the GA4 Explore reporting functionality. You can build on this report, or create other reports depending on the data you want to track.
If none of this makes sense, you can give us a call. We're a digital marketing agency in Cheltenham and would be more than happy to help out.
Sign up for our newsletter.
Stay up to date with latest news, updates and general on-goings.

